Cartes d’ensoleillement et du potentiel d’énergie solaire photovoltaïque du Canada
 Classement PV des municipalités en fonction du potentiel PV annuel (panneau PV orienté vers le sud avec inclinaison=latitude)
Capitales et grandes villes canadiennes
|
Municipalité |
Potentiel PV annuel (kWh/kW) |
|
Regina (Saskatchewan) |
1361 |
|
Calgary (Alberta) |
1292 |
|
Winnipeg (Manitoba) |
1277 |
|
Edmonton (Alberta) |
1245 |
|
Ottawa (Ontario) |
1198 |
|
Montréal (Québec) |
1185 |
|
Toronto (Ontario) |
1161 |
|
Fredericton (Nouveau-Brunswick) |
1145 |
|
Québec (Québec) |
1134 |
|
Charlottetown (Ile-du-Prince-Édouard) |
1095 |
|
Yellowknife (Territoires du Nord-Ouest) |
1094 |
|
Victoria (Colombie-Britannique) |
1091 |
|
Halifax (Nouvelle-Écosse) |
1074 |
|
Iqaluit (Nunavut) |
1059 |
|
Vancouver (Colombie-Britannique) |
1009 |
|
Whitehorse (Yukon) |
960 |
|
St. John’s (Terre-Neuve/Labrador) |
933 |
Grandes villes mondiales
|
Ville |
Potentiel PV annuel (kWh/kW) |
|
Le Caire, Egypte |
1635 |
|
Le Cap, Afrique du Sud |
1538 |
|
Delhi, Inde |
1523 |
|
Los Angeles, É.-U. |
1485 |
|
Mexico, Mexique |
1425 |
|
Regina, Saskatchewan |
1361 |
|
Sydney, Australie |
1343 |
|
Rome, Italie |
1283 |
|
Rio de Janeiro, Brésil |
1253 |
|
Ottawa, Canada |
1198 |
|
Beijing, Chine |
1148 |
|
Washington, D.C., É.-U. |
1133 |
|
Paris, France |
938 |
|
St. John’s, Terre-Neuve/Labrador |
933 |
|
Tokyo, Japon |
885 |
|
Berlin, Allemagne |
848 |
|
Moscou, Russie |
803 |
|
Londres, Angleterre |
728 |
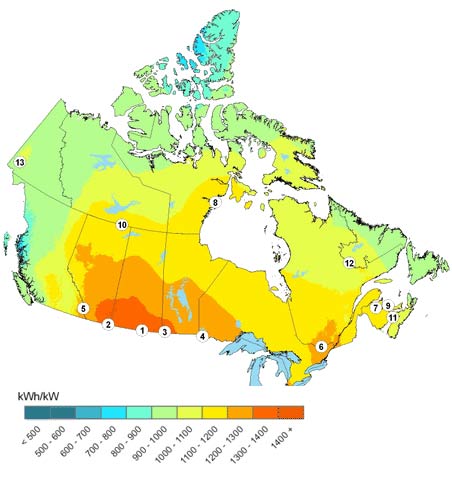
“Points chauds” du PV en fonction du potentiel PV annuel (panneau PV orienté vers le sud avec inclinaison=latitude) pour chacune des 13 provinces et territoires du Canada.
1 Regway SK, 1384
2 Wild Horse AB, 1373
3 Waskada MB, 1370
4 Rainy River ON, 1265
5 Elkford BC, 1236
6 Quyon QC, 1208
7 Chatham NB, 1168
8 Chesterfield Inlet NU, 1158
9 Miminegash PE, 1136
10 Fort Smith NT, 1126
11 Amherst NS, 1125
12 Wabush NF, 1074
13 Burwash Landing YT, 1056
Source: Natural Resources Canada, http://pv.rncan.gc.ca/?&lang=fr